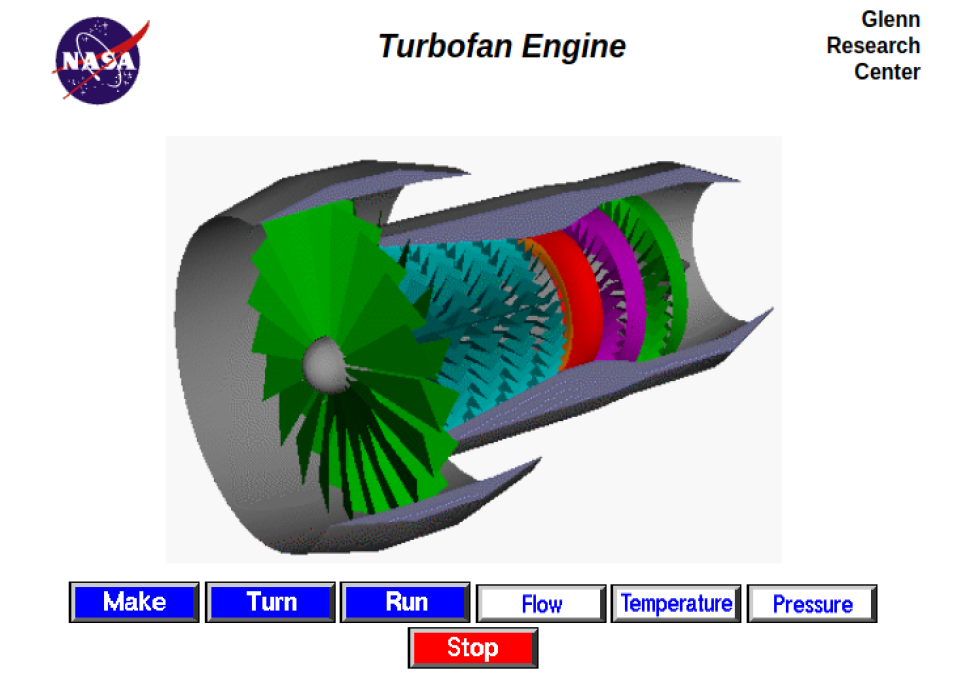
Turbofan is a jet engine in which a turbine-driven fan provides additional thrust. To perform predictive maintenance (PM) on a commercial turbofan engine by a data-driven approach, i.e data collected from the operational jet engines is used to PM modeling. We therefore need to build a model to estimate the Remaining Useful Life (RUL) of a jet engine based on run-to-failure data of a fleet of similar jet engines.
In this project, we design an optimized pipeline for predicting the Health Index (HI) of engines using their sensor measurements. We encoded the intermittent data into a series of images with 21 features and filled the gaps using generative images and successfully employ a Transfer Learning setup to predict the HI of jet engines with as much as 30% input holes.
Dataset: The data set includes time-series measurements of various pressures, tem-
peratures, and rotating equipment speeds that are feasible for the jet engine. All engines are of the same type, but each engine starts with different
degrees of initial wear and variations in the manufacturing process, which
is unknown to the user. There are 3 optional settings that can be used to change the performance
of each machine: altitude (0-42K ft.), Mach number (0-0.84), and throttle
resolver angle (TRA) (20-100). 6 different
flight conditions were simulated that comprised of a range of
values for these 3 operational conditions: Each engine has 21 sensors collecting different measurements related to
the engine state at runtime => 21 output attributes; Collected data is contaminated with sensor noise; Over time, each engine develops a fault, which can be seen through sensor
readings. The time series data stops for each engine when a failure has
occurred for that particular engine. Hence the actual RUL is known based
on the length of the data.
Every training datafile contains 100 run-to-failure engine simulation (corresponding to 100 different engines).
The first column specifies the engine number, second represents the cycle
number, third represents the operational condition in that cycle, and then
there are 21 other columns each of which correspond to the 21 sensor
measurements respectively.
Objective: To come up with a machine learning model to predict RUL based on time-series data of sensor measurements typically available from aircraft gas turbine engines.
Methodology
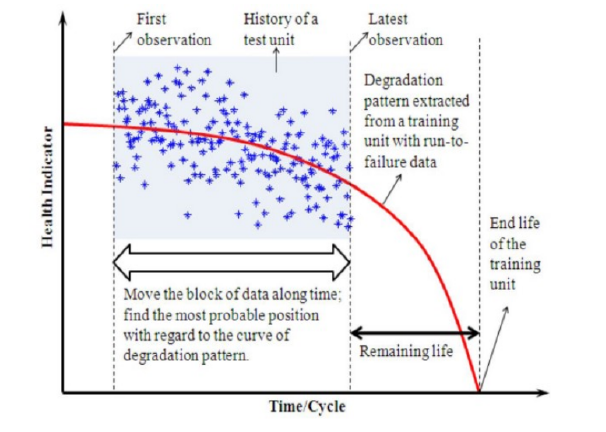
Since the data is in a form of a time trajectory of many (21) sensor data,
then there will be a need to fuse these sensors into a condition indicator
or a health index that help in identifying the occurrence of a failure. The model in testing mode will compare how similar/ correlated the testing fused signal is to the training fused signal. Based on this similarity
comparison, a prediction is made. RUL of the testing unit is estimated based on the actual life of
a training unit that has the most similar degradation pattern.
Considering the time series plots and data distribution of different data columns, we have:
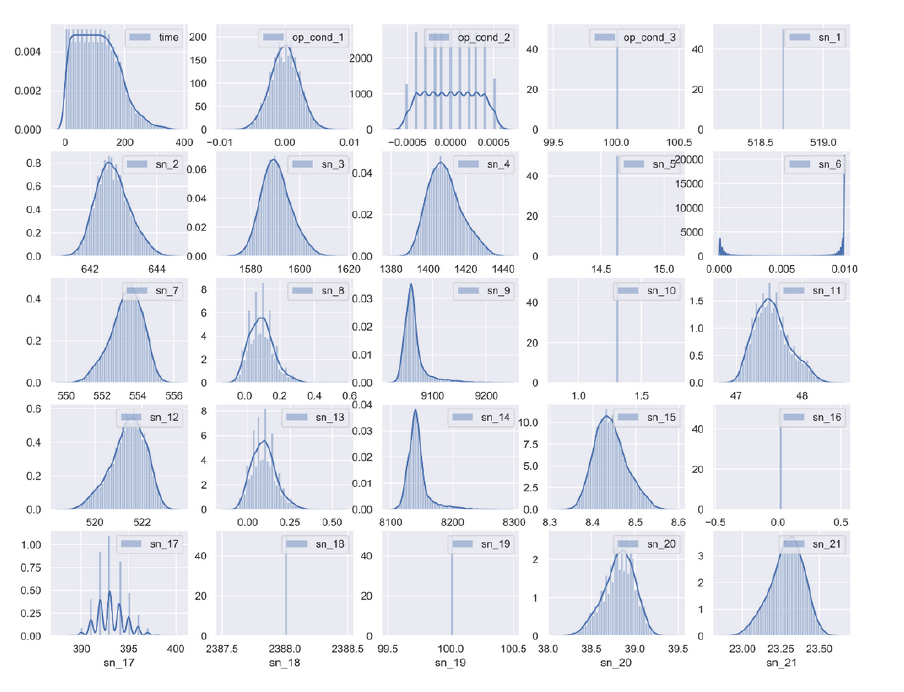
Key Takeaways from data:
|
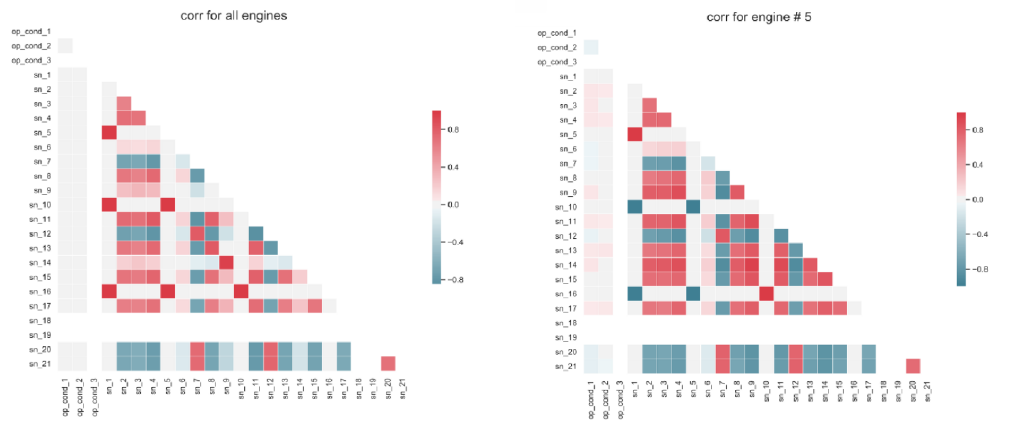
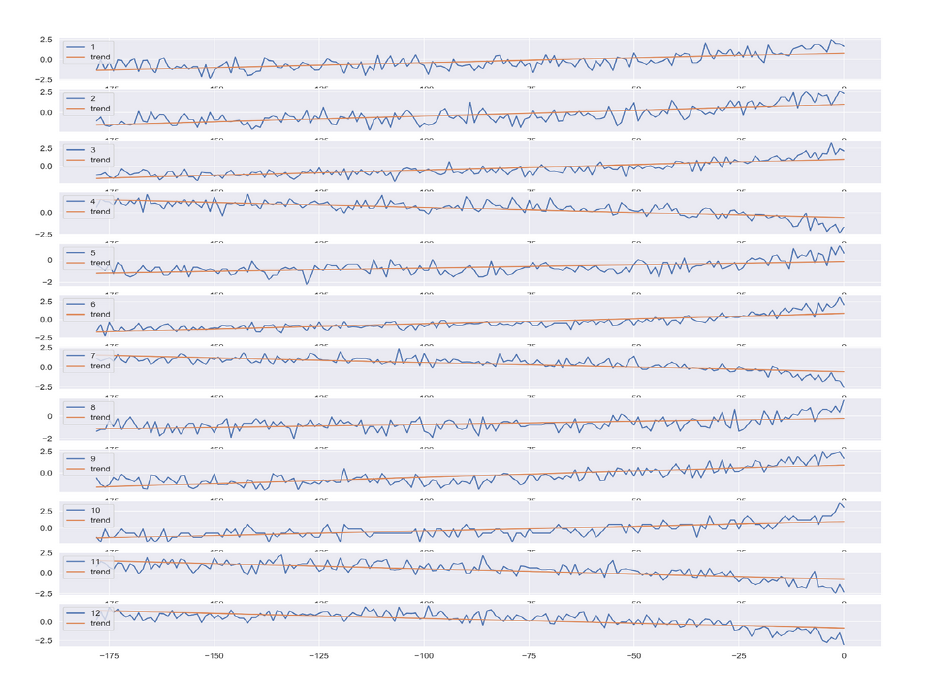
To better analyse the data we have a look at the linear trend of the sensor measurements along the life of a turbofine engine:
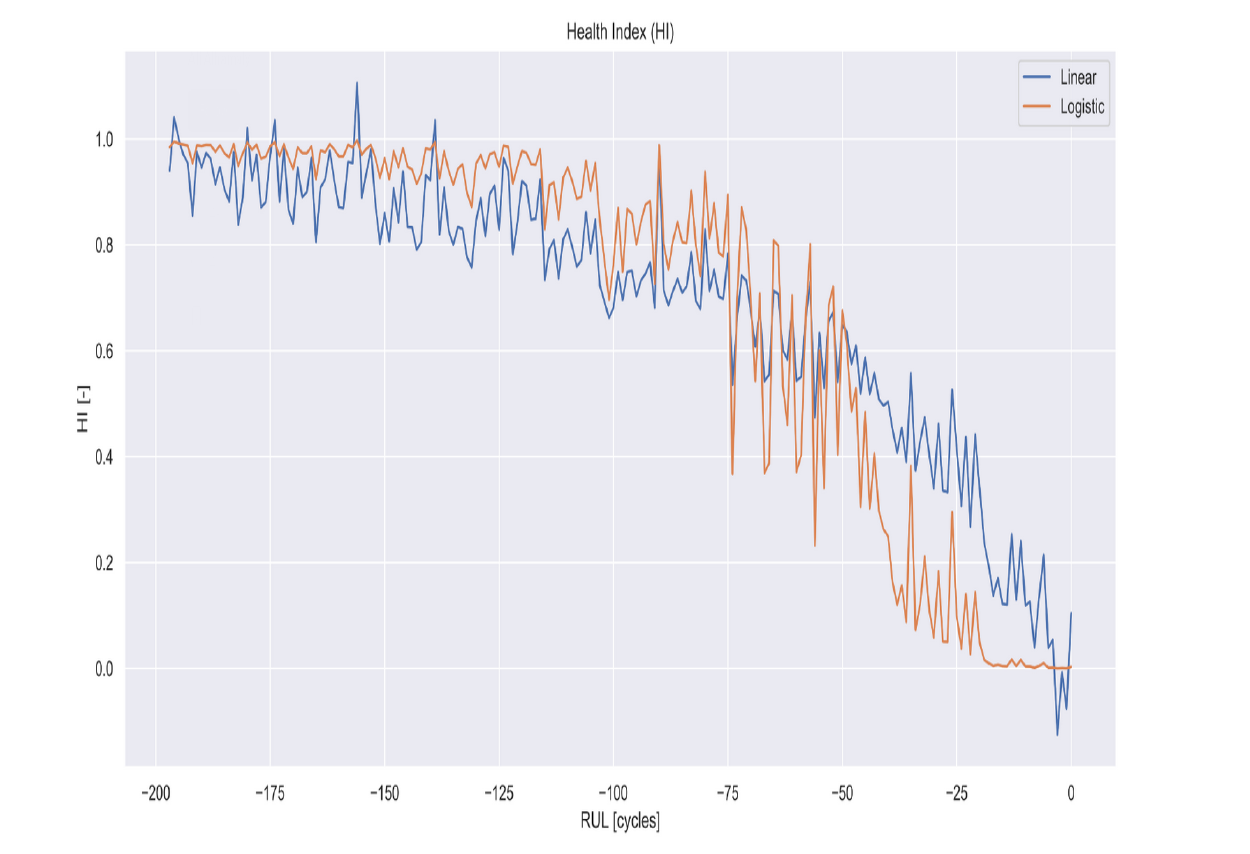
We consider PCA dimensionality reduction as one of the options to fuse the relevant (12 out of 21) sensor data. We find that first PC has 81.6% information, second PC: 5%, and third PC: 4.4%.
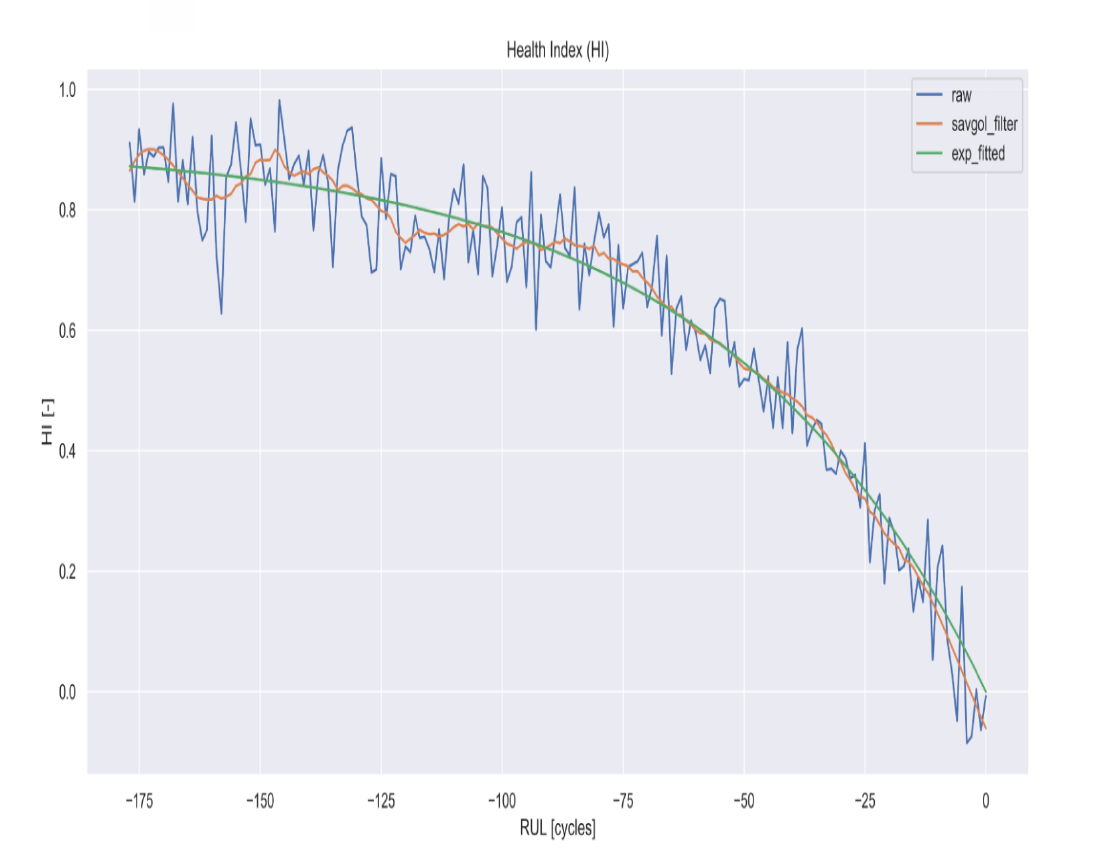
We use 2 approaches: 1) Consider just the first principal component to predict the RUL and use Logistic regression to get values of Health index in the range [0,1] and 2) Fit the model to a simple exponential function y = a[exp(b*t)-1] and compare it with the smoothened version of the raw data (Savgol (Savitzky Golay) filter)
Transfer Learning Approach (Future Work)
Sensor data to Images: Every 21 senors' measurement datapoint at a particular cycle represents 1 particular image and the label given to it is the RUL at that particular cycle. (i.e failure time cycle - current time cycle). 21 attributes correspond to 21 dimensional pt to be represented as an image. 100 of the continuous images with RUL x to x+99 belong to 1 class. Now for predicting the RUL, we intended to find the best fit (least mse loss) with the training set and then predicting the rul by subtracting from the last pt of overlap in the HI vs time cycle fit.
If a new sensor is introduced the image would be basically altered as it would now be corresponding to a 22 sized measurement. This might be considered as a new set of training images and the same nn model which was trained before could be used for testing the new set of images corresponding to 22 sensors. Adding a new sensor is like changing the image features and hence changing the entire dataset. Using the transfer learning setup we suppose make a classifier model for predicting the RUL in the first case we use the same model here. The mse loss is different in this case and hence the best fit might happen somewhere else.
We intend to work on the following in the future:
• Encoding Time Series as Images for Visual Inspection and Classification Using Tiled Convolutional Neural Networks
• Encoding time series data as different types of images, namely, Gramian Angular Fields (GAF) and Markov Transition Fields (MTF)